
What the Models Actually Show
Undercasts are caused by temperature inversions, right?
Yes. And the forecast models do see those inversions. Across 29 years of summit observations joined to the forecasts, the 850 mb − 925 mb temperature difference — the capping inversion in the layer just below the summit — is the single most informative number in the entire dataset, ahead of any cloud field.
What the models cannot do is separate it cleanly. Here is every HRRR near-analysis hour in the sample, undercast against everything else:
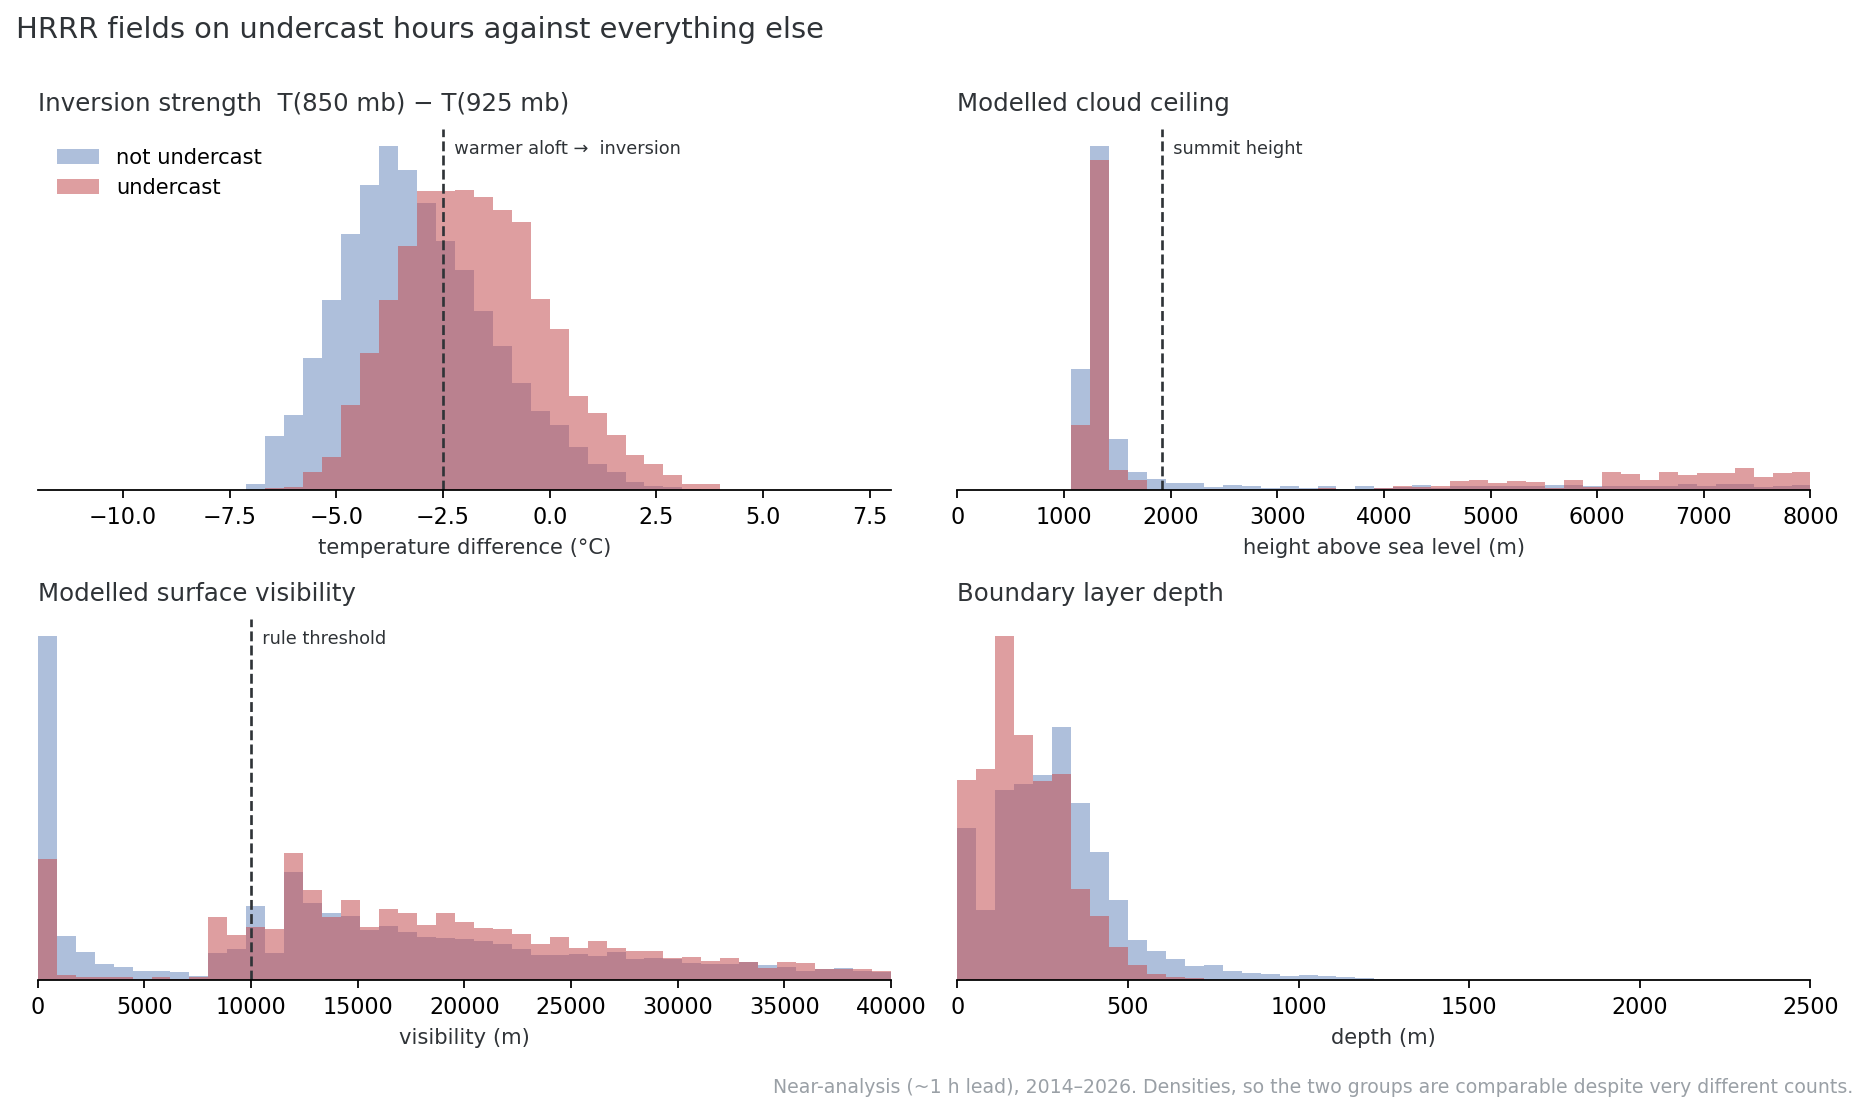
24,315 observations, 3,597 of them undercast. Every panel shows a real shift and none shows a clean split. Undercast hours run about 1.5 K more stable in that layer, but 36% of them sit on the “no inversion” side of the best threshold, and plenty of ordinary hours sit on the inversion side.
Read panel by panel:
- Inversion strength — the clearest of the four, and still two broadly overlapping humps. This is what a genuine but weak predictor looks like.
- Cloud ceiling — the most useful shape here is the long right tail: undercast hours are the ones where the model puts the ceiling well above the summit, or reports none at all. Note that this is the opposite of the intuitive test. Asking for a modelled cloud top below the summit actively selects against undercast, because HRRR’s 3 km terrain flattens this cell to roughly 1,200 m and it has no atmosphere between its own ground and where the observer stands.
- Surface visibility — the tall spike at zero is the summit sitting inside cloud, which is the single most common non-undercast state up there.
- Boundary layer depth — undercast hours cluster in a shallow, capped boundary layer, exactly as the physics would suggest. Also overlapping.
The signal is real, and it is far too weak to threshold. Inversion strength is the best single quantity available, and the best hand-written rule built on it still reaches only precision 0.09 against a 3% base rate. That is why the rule-based attempt fails and why this is a machine-learning problem — not because the models are blind, but because what they see is not separable by any single line.
Individual days
Below you can still walk through specific dates and compare what each model predicted. It is worth doing for a few undercast days and a few clear ones — the overlap in the histograms above is much easier to believe once you have seen two days that look nearly identical in the profiles and completely different out the window.
Model parameters for selected dates with different conditions. Pick an undercast day and a clear one and flip between them: the profiles are often far more similar than the view from the summit was.
